Click here to see the list of research results for 2024.
Click here to see the list of research results for 2023.
Click here to see the list of research results for 2022. Click here to see the list of research results for 2021.
Click here to see the list of research results for 2020.
Click here to see the list of research results for 2019.
Click here to see the list of research results for 2018.
Click here to see the list of research results for 2017.
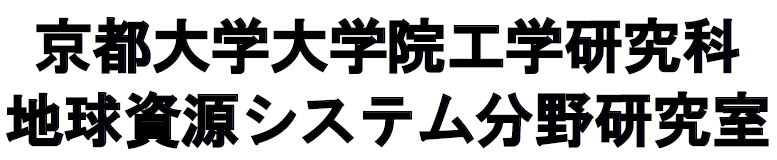
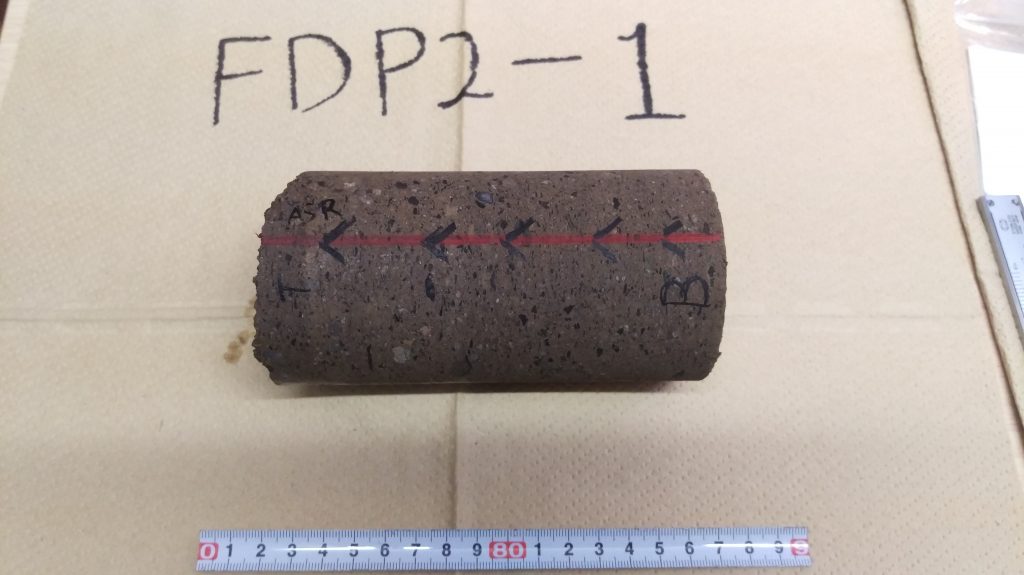
Research on three-dimensional in-situ stress state using drilling core samples
The state of stress in the earth’s crust is a fundamental and important parameter that is closely related to themes such as the mechanism of major earthquakes and the shale gas.
In our laboratory, we are trying to understand the state of crustal stress by focusing on the ASR and DCDA methods, which are the measurement methods using drilled rock core samples.
We have measured stresses on the Nankai Trough and Nojima fault and various oil wells to clarify the stress state. We will continue to explore the mysteries of the Earth from the perspective of crustal stress.
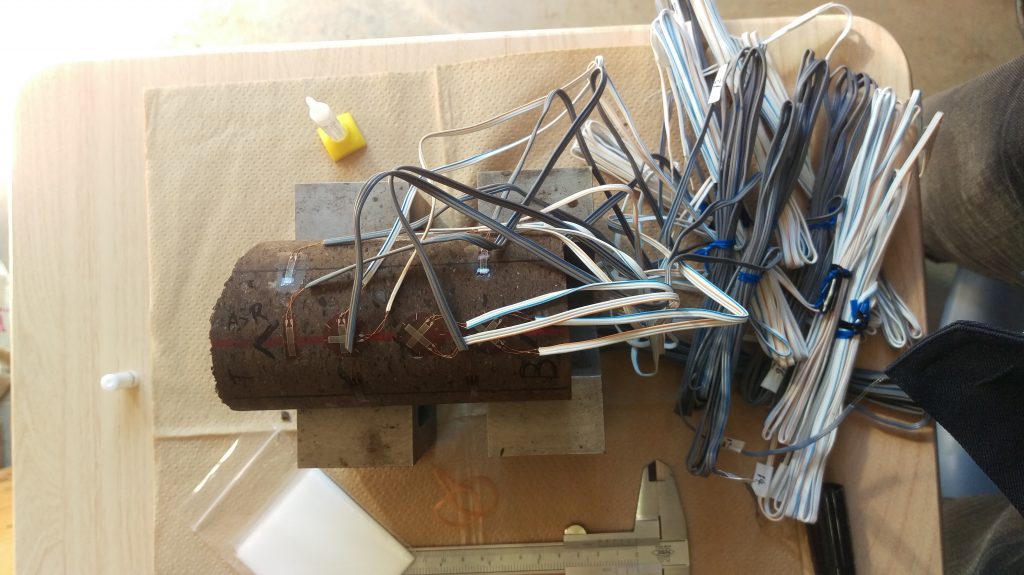
Evaluation of physical properties of rocks
In addition to the exploration and development of the earth’s resources, knowledge of the physical properties of rocks is essential for understanding the fault motion that causes earthquakes. In particular, the evaluation of drilled core samples and well logging data is more accurate than geophysical surveys, and is important as a basic research for advanced simulations. We are evaluating the resistivity and thermal properties of wells drilled on the Futagawa Fault, which is believed to have caused the Kumamoto earthquake in 2016, and have started to develop a measurement method to enable measurements under various conditions.
(Mashiki Town, Kumamoto Prefecture)
Estimation of temperature and physical property distribution for evaluating geothermal resources at great depths
Supercritical geothermal resources, which are thought to exist at a great depth, have more energy than ever before, and their development is expected to enable large-scale power generation with low CO2 emissions. Although the evaluation of physical properties such as temperature is indispensable for the development of geothermal resources, it is difficult to select a specific drilling site due to the lack of in-situ log data and the uncertainties in deep geological data. Therefore, we are developing a method for geothermal resource evaluation with consideration of uncertainties using Bayesian inference and geophysical models based on logging and geophysical survey data acquired in geothermal regions. We are also evaluating the methodology by applying it to promising geothermal resource areas.
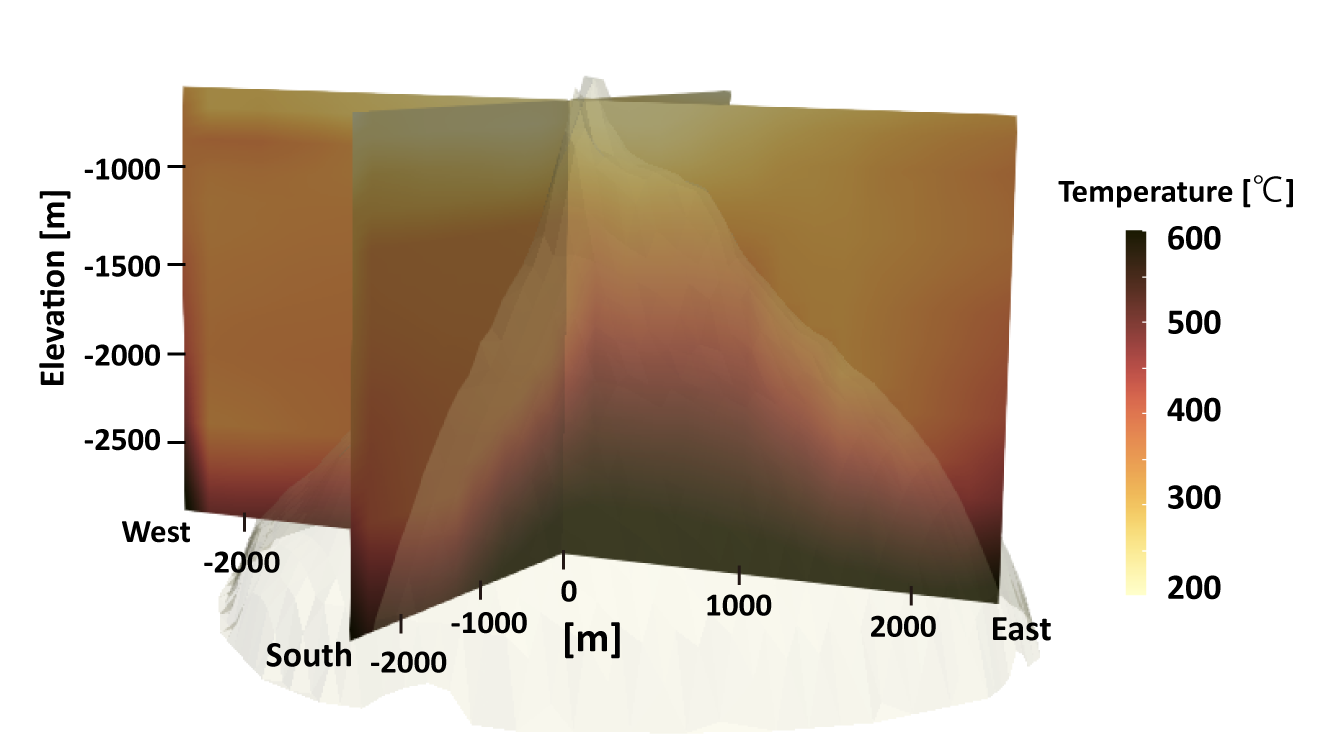
(Ishitsuka et al., 2022 Geothermics)
Estimation of surface displacements by SAR interferometry and subsurface monitoring
SAR interferometry is a method to estimate surface displacement from the phase difference of two observations with different acquisition timings. Satellite-based SAR systems enable to map time-series surface displacements with high spatial density over wide areas. Surface displacement is often induced by changes in crustal stresses and/or groundwater level changes, and the spatial distribution of surface displacement further reflects subsurface structures and heterogeneities. Our lab has developed methods to estimate surface displacement more accurately, and has applied the methods to reveal subsurface characteristics that may be linked to the estimated surface displacement. In addition, we have developed a novel approach to acquire data with a drone-based SAR system.
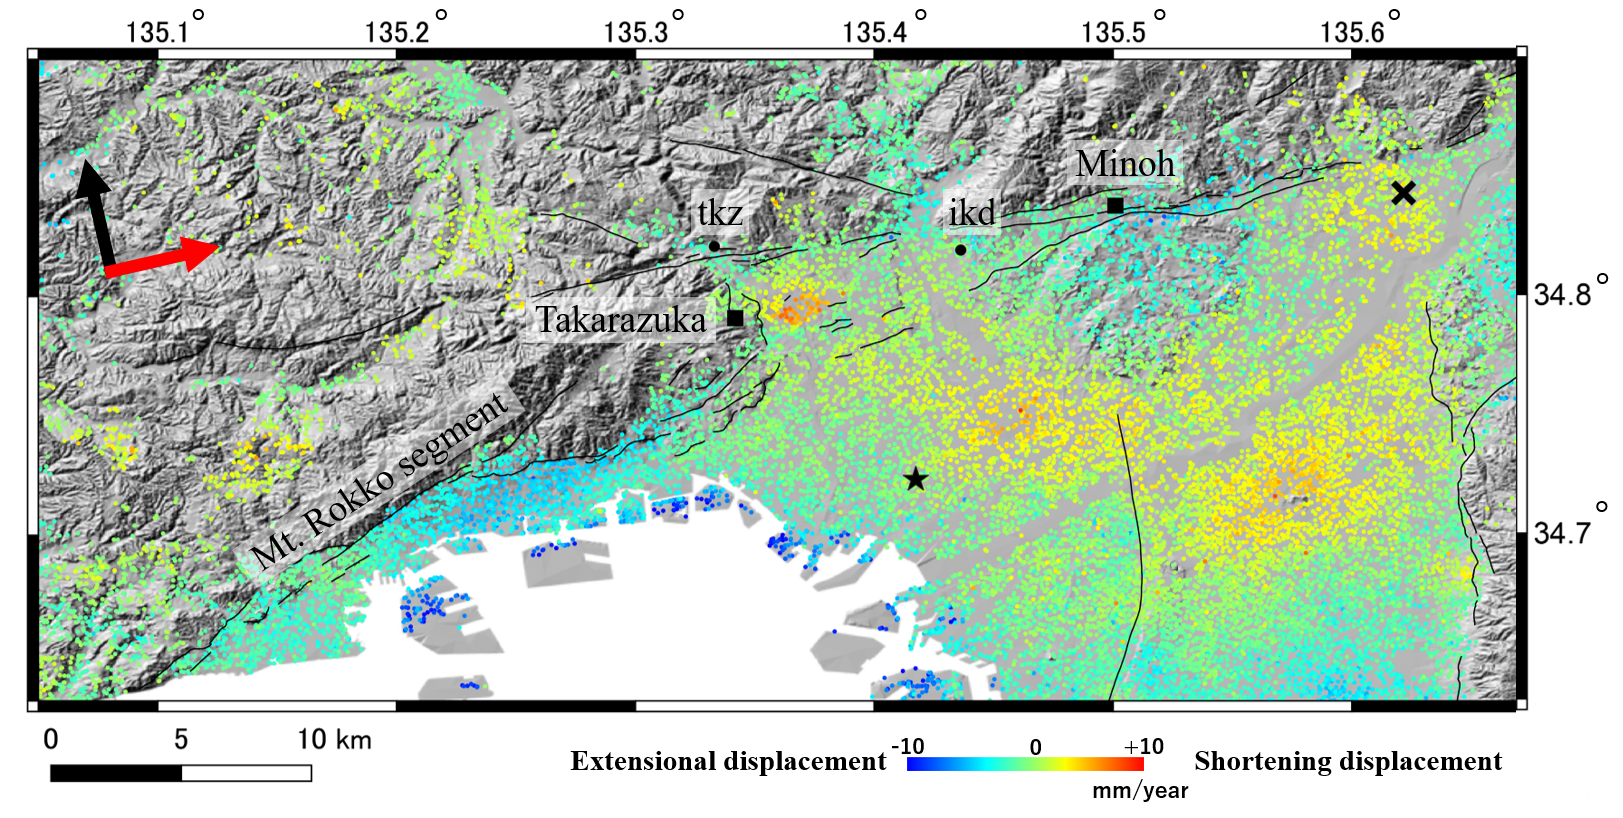
(Shigemitsu et al., 2022 Jour. Japan Soc. Eng. Geol.)
Black cross marks the epicenter of the 2018 northern Osaka earthquake, ★ marks the relative reference point for the surface displacement, black circles mark groundwater level observation points, black squares mark GNSS points, black arrows indicate the direction of satellite flight, red arrows indicate the satellite line of sight, and black lines indicate the location of active faults.